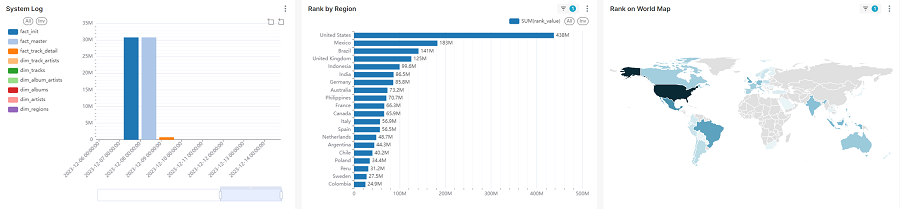
Customer Session Monitoring
Data Refresh Interval: 1 Hour. Data Source: Apache ClickHouse Table. Scheduler: Airflow. Report: Apache Superset. Cloud Environment: AWS EC2
Data Refresh Interval: 1 Hour. Data Source: Apache ClickHouse Table. Scheduler: Airflow. Report: Apache Superset. Cloud Environment: AWS EC2
Environment: Google Analytics Data API, Airflow, Apache ClickHouse, Apache Superset
To create a real-time data analytics dashboard is definitely a change, especially in big data environment. It includes several tricky steps: real-time data ingestion, real-time data cleaning/merging and real-time data visualization. We did a satisfactory solutions evaluation on a near real-time data streaming/analyzing environment by using some cutting-edge techniques. This series of articles will explain …
ClickHouse (CH) definitely has data source integration pipeline to other data sources: RDBS, Cloud storage (for example S3), Kafka, JDBC-based, or Hive etc.. but one of our projects require to migrate historical data from Hive(HDFS) based data warehouse into ClickHouse. Reference: ClickHouse migration documents (https://clickhouse.com/docs/en/cloud/migration/clickhouse-local) Step 1, Create ClickHouse Target Table. Unlike some RDBS systems, …
Not same with other data feed in Google Merchant Center: Imported google sheet, refresh from store directly, API feed doesn’t have a scheduled data refresh. In theory, API feed is similar with manually feed, but using programming. So we need to schedule our Python scripts to run in an automatically frequency. Depends on the platform …
One of our e-commerce customers just built/upgraded their new business websites to sell thousands of merchandise items. They have multiple shopping sites build on top of Shopify and WooCommerce platforms. Initially they used 3rd party plugin and several commercial solutions to publish and manage their merchandise to Google Ads via Google Merchant Center. Since there …
A interactive Covid19 data for Canada. Updated to D3.js v7. Date range filtered by ‘brush’ pan, multiple axis and colored data. Data source can be JSON or csv. (Original updated daily). (Source Data from Google or CIHI, for data visualization only, data accuracy was not verified).
Use D3.js to show an interactive chart. Data Source: csv or Json. GeoJson for map shape.